How to use Timber Market Watch
County-by-County Stumpage Price Comparisons
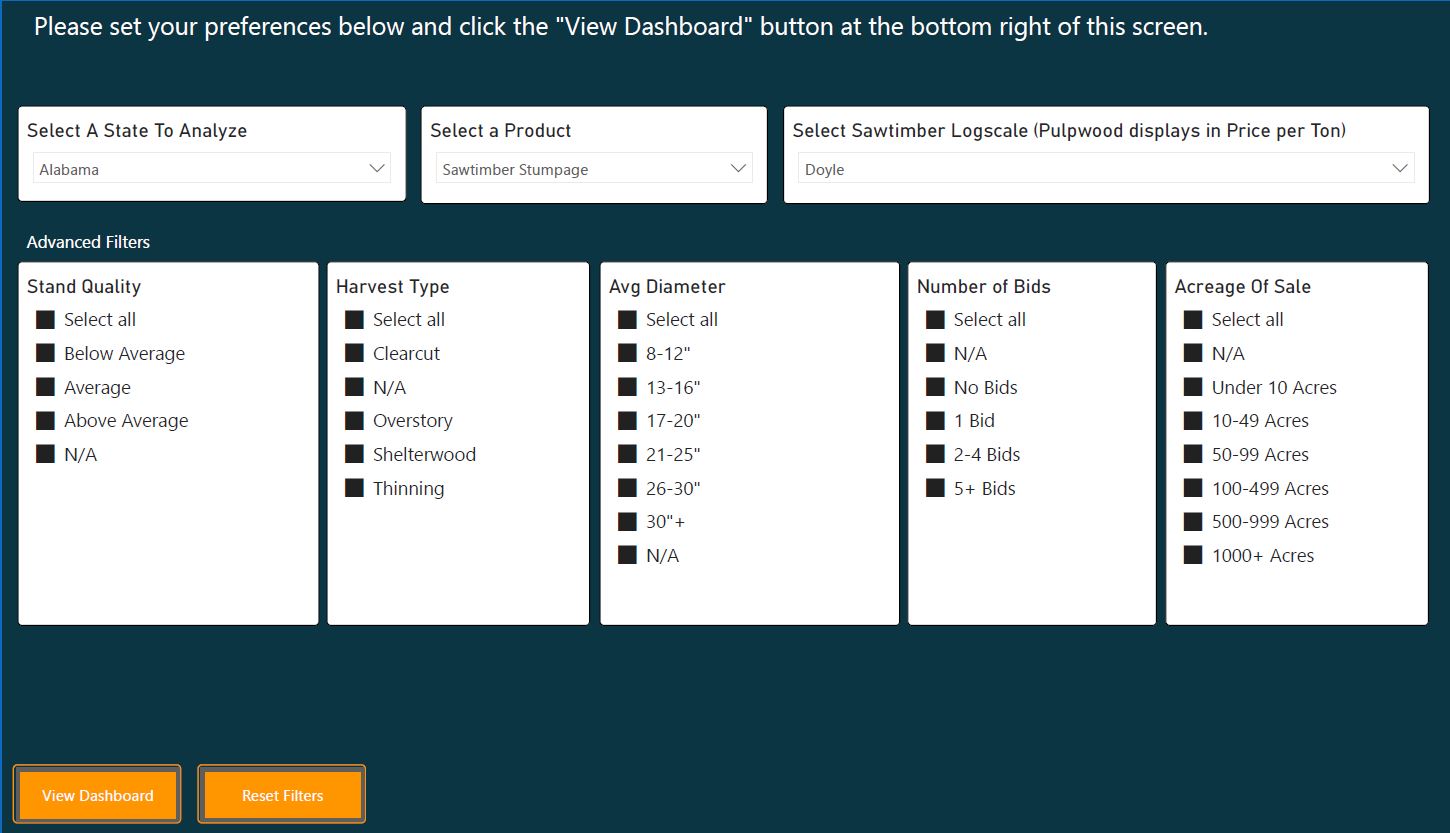
Do you need to know timber stumpage prices in your area of interest? TMW delivers. Begin at the State Price Analysis Dashboard. In the top three pull-down boxes, select your state of interest, timber product, and preferred unit of measure. Then Click on View Dashboard at the lower left-hand corner of the screen.
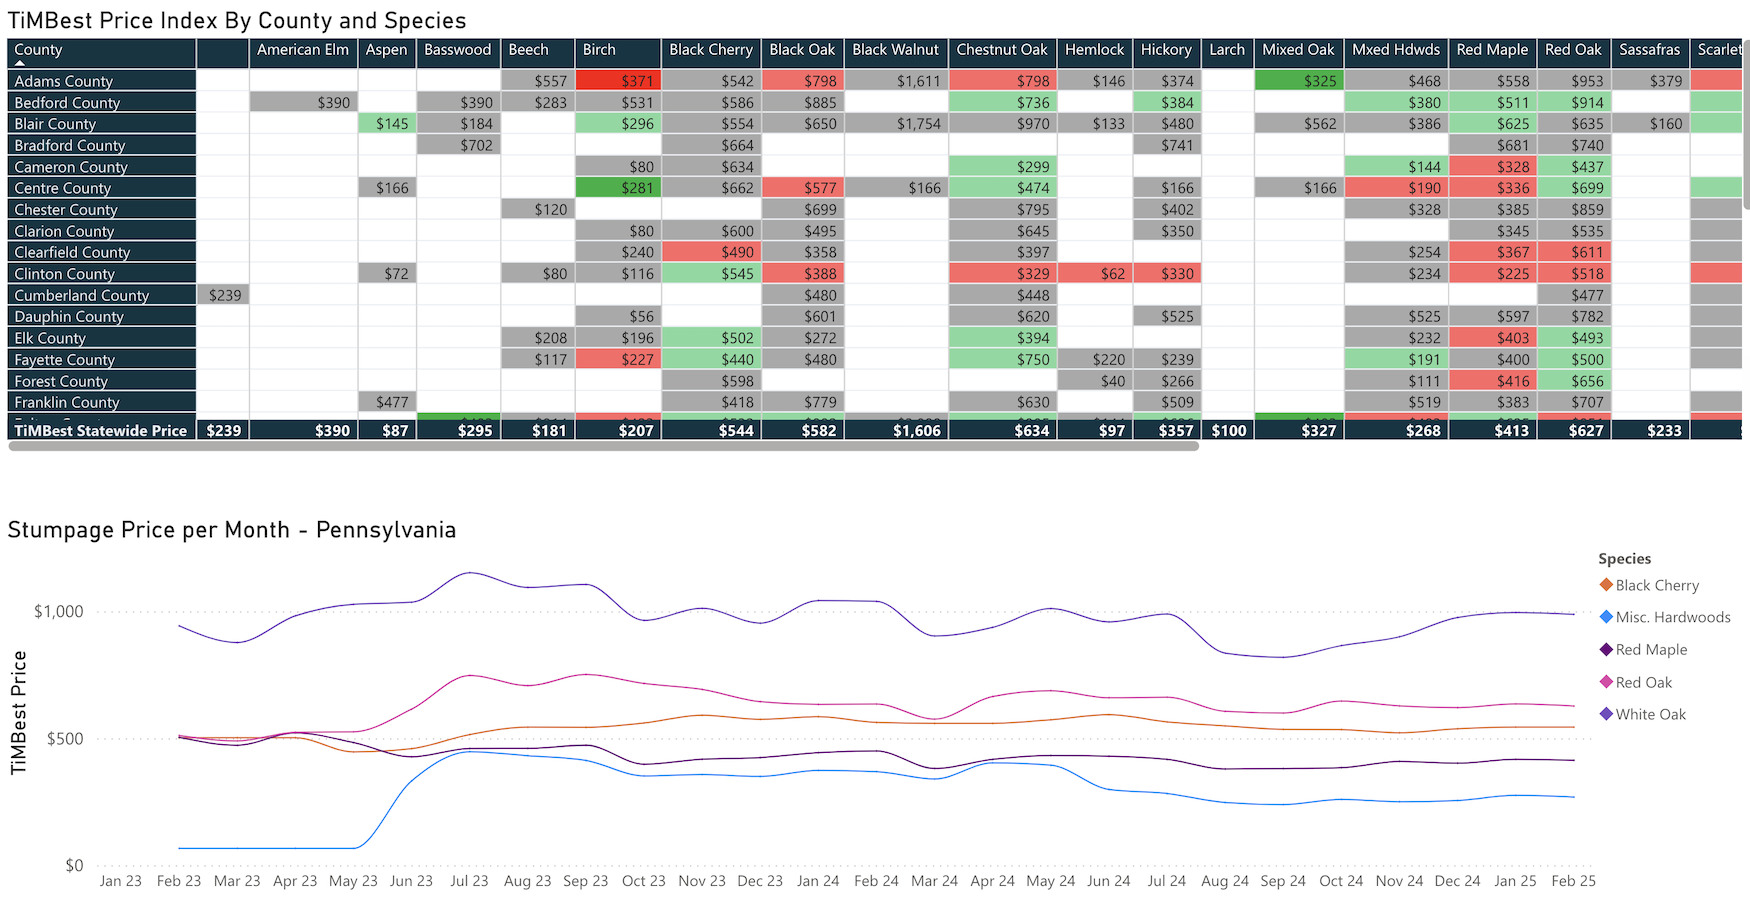
You’ll immediately see the State Price Dashboard for your selected state. The Dashboard presents you with two reports: a TiMBest Price Index summary table and a Price Trend graph of the most important commercial species in that state.

TiMBest Price Index – the tabular data at the top of the page tells you the Timber Market Watch estimate of current prices for each species of timber in each county that we have data for. We call this price the “TiMBest” estimated price of each species in each county. The TiMBest price is a function of all the data we’ve collected from our contributors in each county, weighted by how current each data point is. So, if we have ten sales reported for a county, two in each of the last five months, the TiMBest Price will be an average weighted most heavily by the last two sales reported, and least heavily by the first two sales reported. The algorithm we use to adjust these weights is proprietary and varies from state-to-state and species by species according to market conditions at the time. Our TMW analytics team is constantly at work to update these algorithms as market and data conditions dictate.
The State TiMBest Price Index has several nice features. The first thing you’ll notice is that the table squares are different colors. The colors of the boxes indicate how much the unweighted, actual monthly average price has changed in the last month.
- Gray boxes indicate that the price has stayed within a +/-1% price range.
- Green boxes indicate species in counties that have increased from 1% to 20% (light green) or more than 20% (dark green) in the last month.
- Red boxes indicate species in counties that have decreased from 1% to 20% (light red) or more than 20% (dark red) in the last month.
These colors help you to quickly locate species and counties of interest where timber prices are changing most significantly.
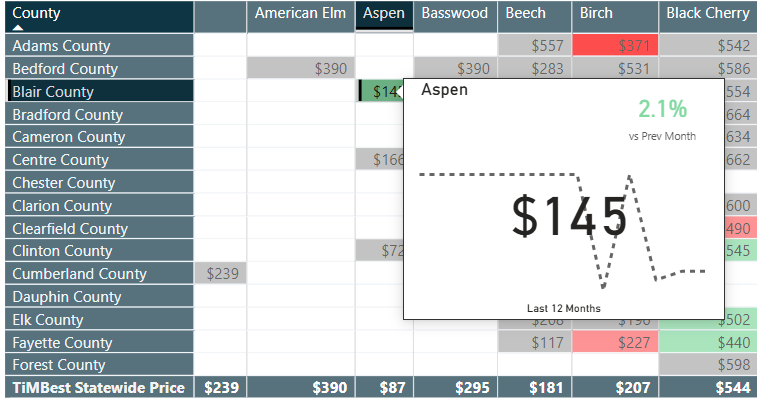
The next thing you’ll notice are the price “scroll over” boxes. As you scroll over each TiMBest price, a box pops up. First thing it does is magnify the price so it’s easier to read. Then, you’ll notice one or more gray points that form a jagged line…these are localized trend lines just for that species in that county. These will give you a better sense of what’s trending over time in just that county. And finally, you’ll see a percentage number in the top right-hand corner of the box. That number is the percentage the average monthly price has changed in the last month.

Finally, you’ll notice the bottom row prices. These are the calculated TiMBest prices for each species in the entire state. These numbers are not as precise as the county-specific prices above, but are useful for state-to-state species comparisons that are available on the National Price Dashboard.
Next, you’ll glance down at the colored trend line graphs. You’ll see colored lines that display the month-to-month actual price averages. (For instance, the point on the line above Jan 25 are the monthly averages for January of 2025). The default trend chart display is the top 5 commercial species in that state, if we have data for at least 5 species. The list of species at the right of the table tells you what species are displayed on the chart, and clicking on the diamond of each species (or Ctrl-clicking / CMD-clicking on multiple diamonds) highlights the species trend lines you’ve selected. (Using the Ctrl (Windows) or CMD (Mac) click is the way to select multiple datasets in Timber Market Watch.) “Scroll over” of the graph lines displays a box that contains a bar chart of the species selected with their relative prices in that month.
But suppose you want a trend chart of just one or two species not shown on the default screen? Easy! Just cursor up to the top (title) row of the TiMBest price data and click on the single species (or Ctrl-click / CMD-click on the multiple species). Boom! You get a trend chart below with just those species you’ve selected. Nice, huh?
Well yeah, pretty good, but I want a graph chart of all species in one county only, not the whole state. No problem…just scroll over and click on the County name and boom, your chart changes to a display of species prices in that one county (or multiple counties combined, if you Ctrl / CMD clicked multiple counties.)
Now, these prices so far have been reflecting all the stumpage price data of all stands and trees submitted, calculated together. But you can drill down for even more detail. The back button in the left-hand toolbar is your data reset button. Click on that and you wind up back at the State Price Analysis filter selection page. Re-choose your state, product, and unit of measure. Then, look at the boxes below those. You’ll see you have the option to select specific segments of the data – Stand Quality, Harvest Type, Acreage of Sale, Number of Bids submitted per sale, and Average Diameter of the stumpage. The default is what you looked at the first time…all data segments combined. But if you want to drill down, it’s easy! For instance, if you wanted to see the price data for only sawtimber 8 to 20 inches in diameter, click on the “Select All” square in the Average Diameter selection box (this de-selects “All”) and then Ctrl / CMD click on 13-16”, 17-20”, and 8-12”. Now, when you click on “View Dashboard” you will see the same State Price Dashboard, but the TiMBest price estimates and the monthly averages will only reflect stems 8 to 20 inches in diameter. The rest of the selection boxes work the same way, and you can combine as many selection criteria as you want to produce a report.

OK, this is all great. But I like to break down the data myself. Can I just download it to a spreadsheet? Sure. We at Timber Market Watch want to make our data as useful to you as possible. Cursor to the top right-hand corner of the price table. You’ll see three dots. Click on these and you’ll see the first choice is “Export Data”. Click on this, then click on the Export button at the bottom. You’ll receive an Excel spreadsheet of the data you have displayed on your screen. Have fun with it! But one thing…your subscriber agreement establishes your promise not to share the Timber Market Watch data with non-subscribers or in public. So please, don’t do that! That would violate your subscriber agreement, and we will cancel your subscription forever without refund when we find out.
And remember…the data you view and/or download is specific to the exact day and time you download it, so remember to note that on your personal analyses. Since TMW is a real-time product, the prices are constantly changing.
State-by-State Stumpage Price Comparisons
If you like to occasionally look at things from a 40,000 foot level, try our Timber Market Watch National Price Analysis Dashboard. Basically, it’s the same thing as above, but instead of comparing counties, you are comparing states. Is Pennsylvania black cherry really the most sought-after black cherry in the country? Where is the best place in the country to build our future sawmill or biochar plant? Timber Market Watch allows you to have the raw material price comparisons for the whole country at your fingertips.
Is that it?
Well, yes, for now. But keep checking back. As the number of data contributors increases and the database grows, we’ll be able to provide even more interesting and insightful data products for your use. If you have specific questions or comments, please use our Feedback Form to let us know what you need. It’ll go on the list of Things To Do, and when we’ve got it done, we’ll let you know!
STAY INFORMED
Join the Timber Market Watch Mailing List
Yes, keep me updated as Timber Market Watch adds new features.
